MPS 2020 Review
In September 2012 we launched a Managed Portfolio Service (MPS). Unique in the industry, by including investment companies and ETFs together with open ended funds, our philosophy was to provide a series of risk targeted portfolios that would be similar to the experience that Smith and Williamson private clients receive. Over eight years later, and not far short of £500 million under management from around 200 financial adviser firms, the performance of the models has been consistently robust whilst at the same time without taking undue risk.

In September 2012 we launched a Managed Portfolio Service (MPS). Unique in the industry, by including investment companies and ETFs together with open ended funds, our philosophy was to provide a series of risk targeted portfolios that would be similar to the experience that Smith and Williamson private clients receive. Over eight years later, and not far short of £500 million under management from around 200 financial adviser firms, the performance of the models has been consistently robust whilst at the same time without taking undue risk.

The aim of this review is to consider how the investment team performed during the year, their thoughts on where the MPS is currently positioned and how they view the year ahead.
How did the MPS perform/fare during the pandemic crisis last spring?
We entered 2020 overweight equities and underweight bonds in the Managed Portfolio Service. This was based on the facts that global manufacturing indices were improving, global corporate earnings were continuing to grow and that Central Bank policies remained accommodative. Our positive stance initially looked correct as the S&P500 index in the US closed at a record high on the 19th February.
Unsurprisingly this risk-on stance did not set us in good stead as pandemic fears gripped stock and bond markets and our performance over the first quarter of the year was poor. It would have been very easy for us to have panicked at this moment, but as it became clear that central banks and governments were going to do whatever they could to support their economies and markets, we decided to hold our nerve. We also saw that the markets had become extremely fast-moving in both directions and due to the mechanics of most investment platforms rebalancing the portfolios could have led to clients being significantly uninvested at just the wrong time. This would have been hugely detrimental to client returns. We therefore held back from making any changes to the portfolios over the quarter and decided to wait for some stability in pricing before making asset allocation decisions. However, one of the many benefits of an MPS range primarily made up of actively managed funds is that whilst we may had made no changes, our underlying managers invariably did. We conducted a significant number of phone updates with our funds in March and April to understand what they had been doing and to gauge how they had been performing. This allowed us to make fully informed decisions when we eventually did rebalance the portfolios in late April.
What did the team do to protect the models during 2020?
This first rebalance was focused on adding some extra stability to the portfolios without taking away the ability to benefit from any rally in equities in the future. At the lower risk end of the range this involved taking some profits from index-linked bonds and gilts which had held up well and recycling the capital into UK and US corporate bonds. We also reduced exposure to UK commercial property and increased the allocation to hedge funds. Within equities we reduced the value element of some of the portfolios and increased the exposure to growth managers, most notably in Japan. At the higher end of the risk scale we slightly reduced our equity allocation where it was still elevated and reduced our direct exposure to India and Russia and increased the US and China.
By July, having seen the markets rebound significantly we felt it was an appropriate time to reduce the equity overweight in the three lowest risk portfolios back to neutral. Our thinking was that investors in these models would not thank us for getting caught out twice should the markets reverse for any reason. We reduced the exposure to UK, US and Japanese equities and again increased the allocation to UK and US corporate bonds.
As we entered the Autumn we saw further clouds of uncertainty on the horizon in the shape of the US election and a possible second wave of COVID. We had also seen the equity overweight in the higher risk models get back to where it had started the year and we felt it was prudent to reduce this. Again, areas that had done particularly well for us were trimmed, namely the US, Japan and Asia.
Not only did we reduce risk in the portfolios as the year went on, but we have also paid particular attention to reducing the cost of the underlying portfolios where we can. Whilst this is always a balancing act as we believe good active management is worth paying up for, we have worked hard to access the cheapest share classes available to us by leveraging the scale of assets under management at Smith & Williamson. This is particularly important in respect of the allocations to fixed income where the returns available are at historic lows and thus every basis point of cost that can be shaved away helps improve returns for our investors. Overall, despite our inactivity in the initial crisis and only four rebalances during the course of the year, turnover in the portfolios was the highest it has been for several years. Although this is something that we try very hard to minimise, the year’s events certainly justified this level of activity.
What investments were the team most pleased to hold and what didn’t work so well during the year?
We had several holdings that performed extremely well for us, the majority of which have a growth focused strategy that was very much in favour throughout most of the year. Pleasingly for us these names were spread across a range of equity geographies and asset classes. Perhaps most interesting is that despite the US markets being one of the strongest over the year, not one of our US holdings features in this list of top performers. We believe this flies the flag for active management, where good managers were able to unearth companies that outperformed their domestic markets by some margin. Holdings of note here were JPMorgan Japanese (+38.7%), Baillie Gifford Japan Trust (+35.3%) and BlackRock European Dynamic (+34.8%). Some of our developing markets names were equally impressive with Schroder Asian Total Return Investment Company (+35.6%) and Hermes Global Emerging Markets (+42.5%) standing out, although they were put into the shade by Fidelity China Special Situations which rose by 68.6%.
Last, but by no means least, it is worth mentioning our core hedge fund position, BH Macro, which rose by 34.9% during the year. This was the third year in a row that this holding has returned double digits for us, but most importantly the bulk of this was achieved during the darkest days of February and March. It has once again proved its qualities as an excellent portfolio diversifier at a time when traditional safe havens such as sovereign bonds provide disaster insurance but very limited upside. It is one of the most expensive funds in our MPS range but, as we have said many times before, we believe it is worth paying up for vehicles if they can justify their position in a portfolio.
As many of our investors will know, we like to run a blend of styles to provide balance across our portfolios and so there were invariably several funds that disappointed over the year. They generally employ more of a value focus and were predominantly, although not exclusively, in the UK list where, despite a strong end to the year, the UK still returned a double-digit loss. Man GLG Undervalued Assets (-16.0%) and RWC Enhanced Income (-12.0%) were the most disappointing. Within developing markets we also had two notable laggards in Utilico Emerging Markets (-14.4%) which is heavily skewed towards infrastructure such as ports and airports that unsurprisingly struggled and BlackRock Emerging Market Equity Strategies (-12.4%) which has a significant contrarian bias and avoided many of the large cap tech names that drove the markets. Finally, and not surprisingly, our key UK commercial property play, Picton Property Income fell by 19.5%. This however is a portfolio with significant exposure to industrial assets that are very much in favour and relatively little to retail. Due to its relatively small size it has proved to be quite nimble in recent years and generally avoided the worst performing areas of the market. We rate the management team highly and with an attractive income stream we believe having another asset class in the mix makes sense for the portfolios. We are hopeful of this rebounding in the coming years.
How is the MPS currently positioned as we begin a new year?
Our fourth rebalance of the year was carried out in December and was primarily driven by the Distribution Technology asset allocation updates. However we took this as an opportunity to move overweight the UK and underweight the US, driven by what we believed to be excess pessimism towards the UK at a time when Brexit would soon be done one way or the other, vaccines were beginning to be used and the UK looked too cheap relative to virtually all other markets. The prospects for sterling also look more positive. Perhaps equally significantly we introduced an allocation to BlackRock Gold & General across the range. This sits in our North America equities allocation and plays to our medium-term view that increased inflation is likely which should benefit the gold price.
Overall, we remain pretty fully invested with an underweight allocation to cash. We are overweight equities and underweight bonds, although we remain overweight alternatives, primarily through hedge funds. Our positive outlook for the UK is also reflected in our overweight to UK corporate bonds. Unsurprisingly, bearing in mind our expectations for inflation in the coming years, our long standing underweight to sovereign bonds, including gilts, and overweight to index-linked bonds remains firmly in place. Within equities, in addition to the above UK and US positions we are overweight Europe as well as Asia & Emerging Markets.
What is your outlook for markets for 2021?
2020 has been an incredibly difficult year for the developed world economies but this has not prevented markets such as that of the US from delivering strong returns. In the emerging world, Asia has performed well, partly reflecting that it was the first region to be hit by the crisis and thus the first to emerge from it; Asia has also managed COVID-19 relatively well compared to the US, UK and Europe, perhaps reflecting the benefit of experience garnered during other public health emergencies such as SARS.
While the news on the mutant form of the virus is clearly unwelcome, we remain positive on the outlook for stocks, not least because we believe policymakers will throw everything they can at the disease in order to beat it. We also think monetary policy will remain highly accommodative until the world has a clear route out of the crisis; low or near-zero interest rates are typically very supportive of long duration asset classes such as equities. We also think that stock markets that have been significant laggards in 2020, most notably the UK, can close some of the performance gap relative to other regions in 2021.
Conclusion
2020 was an extremely challenging year for economies and markets, however having a dedicated MPS team with the resource available at Smith and Williamson enabled the models to continue to perform exceptionally well for clients.
I am confident that this will continue to be the case in 2021 as we look to deliver yet another year of strong risk adjusted performance. We will ensure we stay in regular communication with you so that in turn you can report on our progress with your clients.
*all data sourced from Factset as at 6/1/20. Please note all above performance figures unless otherwise stated are for the 12 months of 2020.
Cumulative performance to 31 December 2020
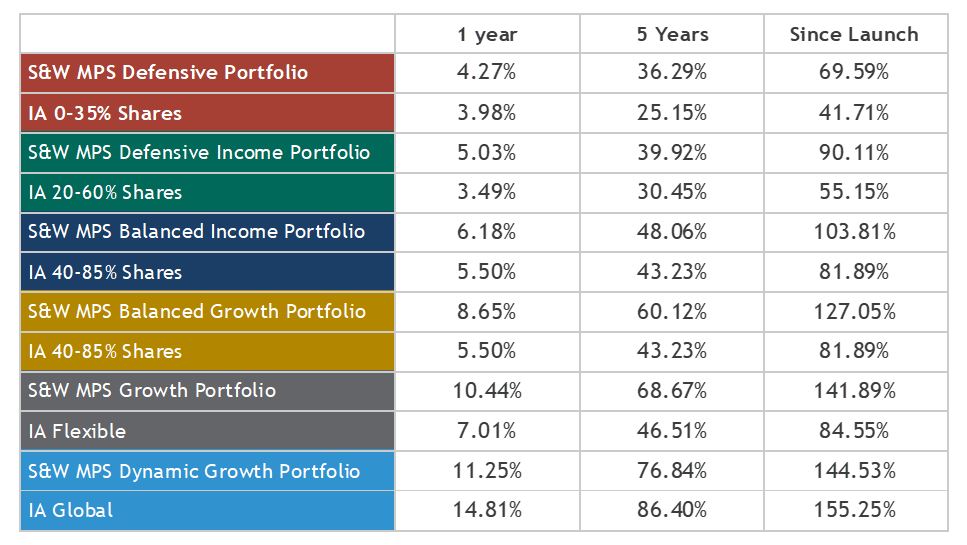
Past performance is not a guide to future performance.
Capital at Risk. The value of investments and the income from them can fall as well as rise and you may not receive back the original amount invested. The portfolio’s performance is shown below after the effects of all charges made by the underlying holdings but before accounting for S&W’s investment management charge, and any platform fees and adviser charges. The effect of these additional fees and charges would be to reduce the returns shown. Periods over 1 year are annualised. IA = Investment Association. Source: Smith & Williamson Investment Management / FactSet as at 31.12.20 (unaudited). Periods over 1 year are annualised.
DISCLAIMER
By necessity, this briefing can only provide a short overview and it is essential to seek professional advice before applying the contents of this article. This briefing does not constitute advice nor a recommendation relating to the acquisition or disposal of investments. No responsibility can be taken for any loss arising from action taken or refrained from on the basis of this publication. Details correct at time of writing.
Smith & Williamson Investment Management LLP
Authorised and regulated by the Financial Conduct Authority.
Registered in England No. OC 369632. FRN: 580531
Smith & Williamson Investment Management LLP is part of the Tilney Smith & Williamson group.
© Tilney Smith & Williamson Limited 2021
Ref: 08421lw
Disclaimer
This article was previously published on Smith & Williamson prior to the launch of Evelyn Partners.


