Money for nothing and your (stimulus) cheques for free
We need to talk about money supply

We need to talk about money supply

Global attention has been focused on the Coronavirus vaccine, Brexit and a new president in the US. The growth in money supply in the US was never likely to attract headlines, but it may be every bit as important for the global economy.
US broad M2 money supply increased by 27.5% in January 20211. This measure includes bank current accounts, savings accounts (household and corporate) and the monetary base (i.e. the Federal Reserve’s balance sheet). To put this in context, it is the fastest growth rate in 150 years and even surpasses that seen in the 1940s when the US was preparing for war.
Chart 1: Record US broad M2 money supply growth from 150 years of data
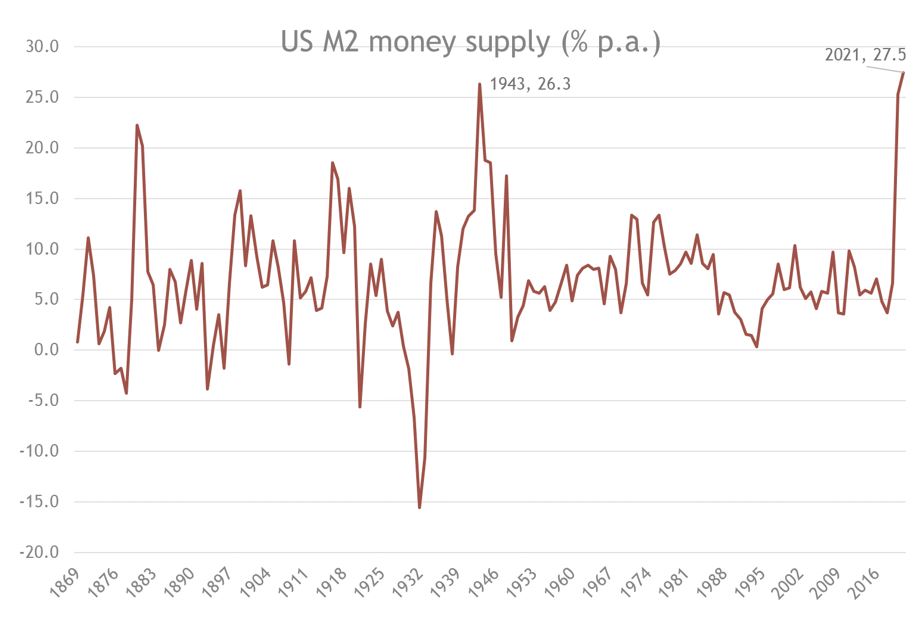
Source: Refinitiv Datastream, St. Louis Fed/Smith & Williamson Investment Management LLP, Data as at 11/02/2021
The reasons for this expansion are clear: the fiscal and monetary policies pursued by the US government in the wake of the pandemic have driven up money supply. The government has provided cheques to its citizens, for which the Fed has provided financing. Stimulus cheques are going into bank accounts, which in turn pushes up money supply. Banks are lending money, which has ended up in deposits, also increasing money supply. With more money flowing into the financial system, the fuel is there to drive up economic growth and stocks.
Risks from rapid money supply growth
Greater money flows into the financial system also come with risks. Recently, retail traders have taken advantage of easy access to money and low rates to leverage up their investments. Excluding what investors hold as cash and profits from previous trades, US net margin debt stands at a record $333bn2. By borrowing money at the “margin”, this can lead to significant market dislocation, where equity prices move far away from their underlying future earnings potential.
This market dislocation was apparent last month in so-called “meme” stocks. One example is GameStop, a US physical video game retailer that has struggled to make a profit over the last couple of years. Even so, its share price still rose 23 times at its peak in 11 days in January, as a market frenzy emerged when retail traders used social media to group together to buy shares knowing that some hedge funds were positioned for a fall in the stock price3. Given the lack of available shares to buy in the market, hedge funds were forced to purchase GameStop shares at higher and higher prices in what was a classic “short-squeeze”. This crowd behaviour shows that investor positioning and money flows can have a greater impact on share prices than the underlying business fundamentals in capital markets. The risk is that rapid money supply growth leads to financial bubbles that lower broad equity market valuations down the road.
Moreover, traditional valuation metrics like the Price-to Earnings ratio (PE) have been lifted by an expansion in central bank balance sheets and money supply. To get some perspective, it is telling that when the pandemic hit last year, G4 central bank assets rose by just over $8 trillion, almost equal to the $10 trillion increase over the previous decade to end-20194. Subsequently, the global equity 12-month forward PE ratio took another leg up to 20x, the second highest level since the 25x peak during the 2000 dot.com bubble5.
Chart 2: The expansion in central bank assets has boosted equity valuations
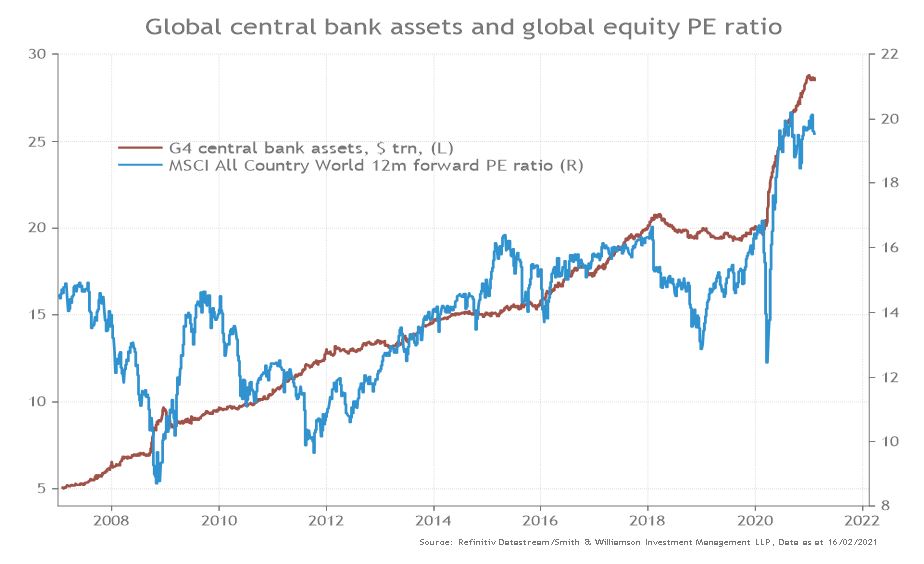
Source: Refinitiv Datastream/Smith & Williamson Investment Management LLP, Data as at 16/02/2021
While there can be little doubt that standard valuation metrics like the Price-to-Earnings are at historically elevated levels for equity markets, notably in the US, this should be considered in the context of historically low (unattractive) bond yields. Valuation metrics are also often poor market timing tools; they can become more stretched over long periods leading overly cautious investors to miss out. Considering that the consensus of analysts forecast strong global Earnings Per Share growth of nearly 29% for 2021 and a further 15% in 2022, valuation multiples can continue to expand to even higher levels to capture the positive earnings backdrop and supportive money supply growth6.
To gauge how much equities could rally, we measure market capitalization as a share of broad money supply. On our calculations, the market is worth 167% of money supply7. This is not as over-valued as it was during the Dotcom bubble when this ratio was over 250%8. If equities were ever to reach that record ratio, they could rise a further 50% or so from here. Importantly, when we look at the UK, it looks undervalued relative to the money supply, which suggests more potential upside than in the US9.
Chart 3: Market values do not look extreme relative to broad money supply
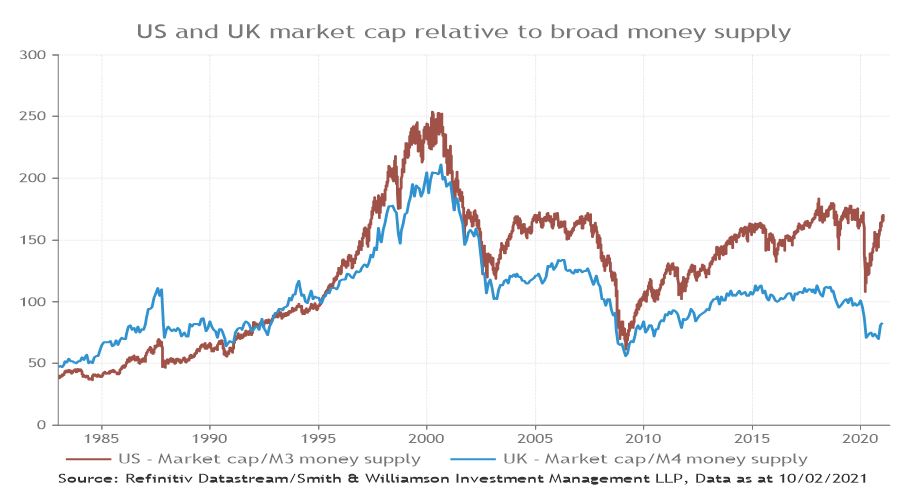
Source: Refinitiv Datastream/Smith & Williamson Investment Management LLP, Data as at 16/02/2021
There are other reasons that suggest valuations are not as worrying: synchronised global recovery will help float all the boats, while generous government support means that many consumers have plenty of savings and after a year of lockdowns, they will want to spend them. If this leads to upside earnings surprise, valuations will look less scary. In the US, Democrats with an eye on the mid-terms will do everything possible to keep growth flowing into 2022.
In summary, the Federal Reserve have made it clear that they intend to let the US economy run hot and not withdraw stimulus. So, despite a great run already, stocks may not be in the dire straits predicted by some bearish investor pundits and parts of the media. It is a lesson in ‘don’t fight the Fed’.
That said, the news on money supply is well-understood by markets and there are potential risks in the longer term, such as a rising inflation and rising rates. Our view is that investors should remain positive for now, but that they need to stay liquid and diversified – yield curves and FX rates may prove the best leading indicators.
Sources:
1,4,5,6,7,8,9 Refinitiv Datastream, data as at 16 February 2021
2 FINRA Margin statistics, data as at 23 February 2021
3 The ‘stonk’ bubble poses significant global risks, Carson Block, 11 February 2021
DISCLAIMER
By necessity, this briefing can only provide a short overview and it is essential to seek professional advice before applying the contents of this article. This briefing does not constitute advice nor a recommendation relating to the acquisition or disposal of investments. No responsibility can be taken for any loss arising from action taken or refrained from on the basis of this publication. Details correct at time of writing.
Risk warning
Investment does involve risk. The value of investments and the income from them can go down as well as up. The investor may not receive back, in total, the original amount invested. Past performance is not a guide to future performance. Rates of tax are those prevailing at the time and are subject to change without notice. Clients should always seek appropriate advice from their financial adviser before committing funds for investment. When investments are made in overseas securities, movements in exchange rates may have an effect on the value of that investment. The effect may be favourable or unfavourable.
Note to editors
Tilney Smith & Williamson is a leading financial and professional services firm providing a comprehensive range of investment management, tax, financial advisory and accountancy services to private clients and their business interests. The firm’s c1,800 people operate from a network of offices across the UK, Ireland and Channel Islands. The Financial Conduct Authority does not regulate all of the products and services referred to above, including tax, assurance and business Services.
Smith & Williamson Investment Management LLP is part of the Tilney Smith & Williamson group.
Smith & Williamson LLP
Regulated by the Institute of Chartered Accountants in England and Wales for a range of investment business activities. A member of Nexia International.
Smith & Williamson Investment Management LLP
Authorised and regulated by the Financial Conduct Authority.
Smith & Williamson Investment Services Limited
Authorised and regulated by the Financial Conduct Authority.
Ref: 24721lw
Disclaimer
This article was previously published on Smith & Williamson prior to the launch of Evelyn Partners.


